Why investing isn’t as risky as you might think
Discover why investing isn’t as risky as you might think and how keeping a long-term perspective can help you build wealth with confidence.
Thinking about investing but worried it’s too risky? You’re not alone. Many people share this concern, especially when they first consider putting their money to work. While the idea of investing might seem intimidating at first, the reality is often far less risky than it appears. In fact, when you step back and look at the bigger picture, investing can be a powerful way to build wealth over time. Here, we explain why the risks are often overestimated, so you can feel more confident and informed as you begin your investing journey.
1. Stock markets rise over time
That’s not to say the stock market never faces setbacks. In fact, periods of decline are a natural part of its cycle. However, keeping a long-term perspective can help you see that, even after downturns, the market has a strong tendency to recover and continue its upward path.
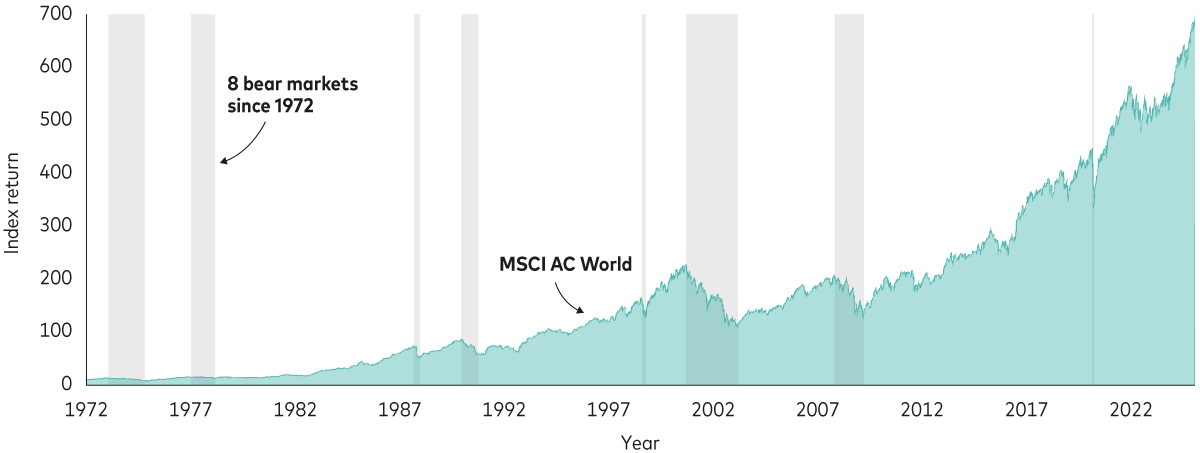
For example, since 1972, the MSCI World Index, which tracks the performance of global stocks, has experienced eight ‘bear’ markets (the grey shaded areas in the chart below). A bear market is when the index drops by more than 20% from its most recent high. After each bear market, the index bounced back and continued to grow. This pattern shows that if you stay invested for a long time, you’re more likely to see your money grow, even if there are some rough patches along the way.
The stock market’s resilience: growth through periods of decline

Past performance is not a reliable indicator of future results.
Notes: The chart shows the MSCI World Price Index from 1 January 1972 to 31 December 1987 and the MSCI AC World Price Index thereafter. The grey shaded areas represent bear markets, defined as price decreases of more than 20% from the most recent high.
Source: Vanguard calculations in GBP, based on data from Refinitiv, as at 17 January 2025.
2. Bull markets are longer and stronger than bear markets
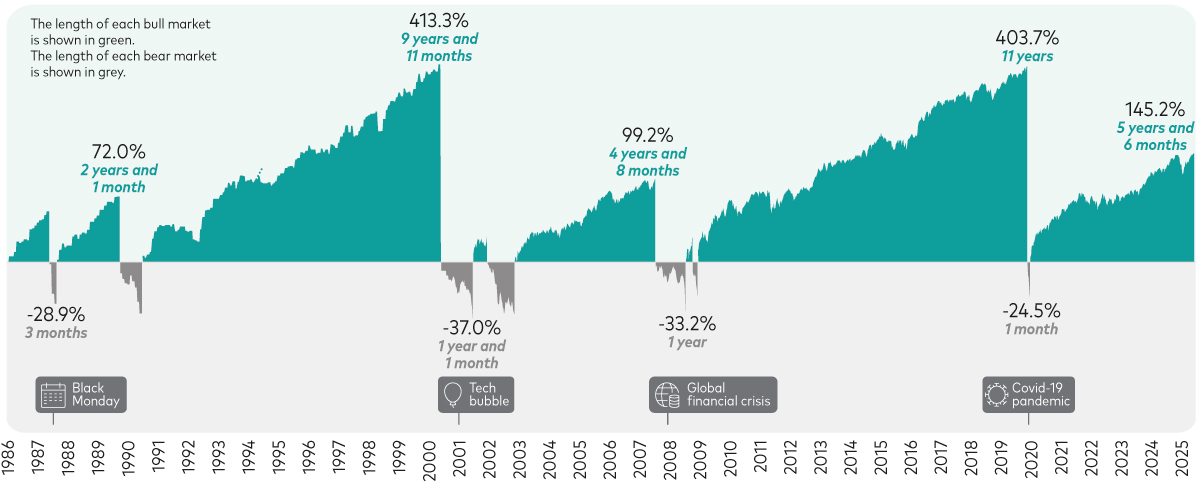
The opposite of a bear market is a ‘bull’ market – when the index rises by more than 20% from its most recent low. If you look at the chart below, you’ll see that these periods of growth (highlighted in green) tend to last longer and be larger in magnitude than the declines marked by bear markets (highlighted in grey). This means that the gains you can make during bull markets often outweigh the losses during bear markets. While the stock market can drop suddenly, history shows that the downturns don’t tend to be as severe as they may seem and periods of recovery are often strong and steady.
Bull and bear markets over time

Past performance is not a reliable indicator of future results.
Notes: Based on the MSCI AC World Total Return Index from 1 April 1986 to 31 August 2025. The calculations use monthly total returns reported at a weekly frequency up to 31 December 2000, and weekly total returns after that date.
Source: Vanguard calculations in GBP, using data from Morningstar, as at 31 August 2025.
3. The longer you invest, the lower the chance of losing money
It can help to think of investing as a marathon, not a sprint. When you run a marathon, you might face some challenging moments, but if you keep going, you’ll reach the finish line. In much the same way, staying invested for longer periods can significantly reduce your chances of losing money.
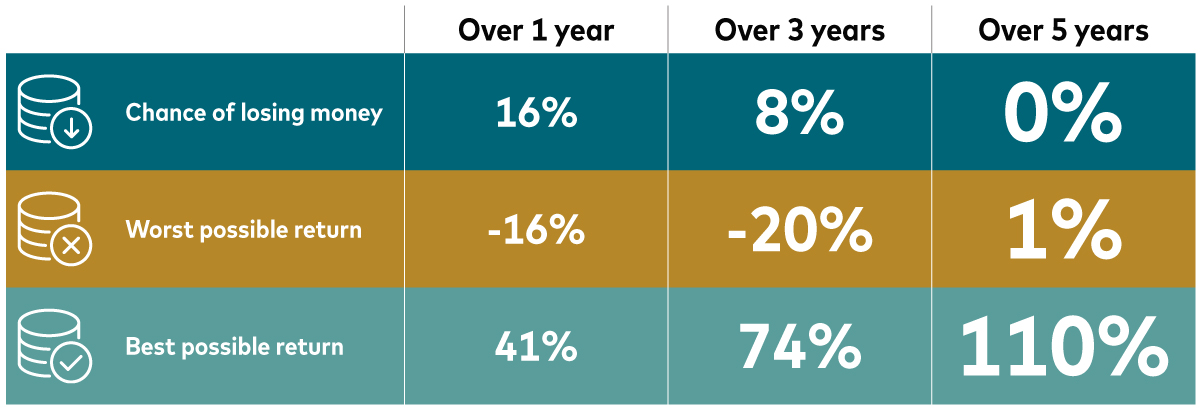
The table below demonstrates how risk declines the longer you keep your money invested. It shows the chances of losing money and the worst and best returns for a portfolio made up of 60% shares and 40% bonds1 across different time spans since 1990. By comparing these figures, you can see that patience and a long-term perspective are key to investment success. So, if you’re thinking about investing, consider it a long-term commitment to help your money grow.
Chances of losing money versus time spent invested

Past performance is not a reliable indicator of future results.
Notes: The 60% shares/40% bonds portfolio is represented by the MSCI AC World Total Return Index and the Bloomberg Global Aggregate Index. The data covers all the 1, 3 and 5 year periods from 1 February 1990 to 31 December 2024.
Source: Vanguard calculations in GBP, based on data from Refinitiv, as at 21 July 2025.
It’s important to note that the examples are based on globally diversified indices. You can get exposure to these by investing in index funds, which track the performance of a specific index (also known as a benchmark2). While many index funds provide broad exposure, others focus on certain industries or regions of the world. There are also active funds, where the fund managers select investments to try to beat a benchmark. The results of these funds may differ to the examples above, but all offer ways to tap into the growth potential of the markets.
4. Cash can be risky too
You might think that keeping your money in a savings account is always the safest choice, but cash can be risky too. This is because of inflation – the steady increase in prices over time. As things get more expensive, the purchasing power of your money shrinks. For example, what you could buy for £56 in 2004 would cost you £100 in December 20243. That means the cost of everyday items has almost doubled in 20 years.
If you’re saving for something less than five years away, keeping money in a savings account can make sense. But for long-term goals, inflation can erode your savings. For example, £10,000 saved in cash in 2004 would be worth only £4,314 in “real” terms today – that’s 57% less. The same amount invested in the global stock market would be worth £70,253 in today’s money – a 600% increase4. While past performance doesn’t guarantee future results, these numbers show how investing can help your money grow and keep up with rising prices.
5. Diversification helps spread risk
You can reduce risk by spreading your money across different types of investments, such as shares and bonds, as well as different industries and regions of the world. If one type of investment or part of the market isn’t doing well, others might be performing better, balancing out the overall risk.
At Vanguard, you can build a diversified portfolio yourself by choosing from our wide range of low-cost individual funds. Or you can keep things simple by picking one of our LifeStrategy funds or Target Retirement funds, which combine shares and bonds in one ready-made portfolio.
For clients in our managed service we select investments for you based on how you feel about risk. We manage your portfolio so you don’t need to monitor the market or attempt to make complex investment decisions yourself.
By choosing the approach you feel most comfortable with, investing can be far less risky than many people assume, helping you grow your wealth steadily over time.
1 Bonds are a type of loan issued by governments or companies, which typically pay a fixed amount of interest and return the capital at the end of the term.
2 A benchmark is a market index, or combination of indices, that investors use to measure investment performance. An index typically measures the performance of a group (or ‘basket’) of investments, such as a basket of shares or bonds, that are intended to represent a certain area of the market.
3 Source: Bank of England inflation calculator.
4 Cash returns represented by the UK Sterling Overnight Index Average benchmark (SONIA) and global shares by the FTSE All-World Index with dividends reinvested; and inflation by the UK Retail Price Index (RPI). SONIA reflects the average rate of interest banks pay to borrow overnight. Vanguard calculations based on period 31 December 2003 to 31 December 2024.
Investment risk information
The value of investments, and the income from them, may fall or rise and investors may get back less than they invested.
Vanguard Target Retirement Funds and Vanguard LifeStrategy® Funds may invest in Exchange Traded Fund (ETF) shares. ETF shares can be bought or sold only through a broker. Investing in ETFs entails stockbroker commission and a bid- offer spread which should be considered fully before investing.
For further information on risks please see the “Risk Factors” section of the prospectus on our website.
Important information
Vanguard only gives information on products and services and does not give investment advice based on individual circumstances. If you have any questions related to your investment decision or the suitability or appropriateness for you of the product[s] described, please contact your financial adviser.
For further information on the fund's investment policies and risks, please refer to the prospectus of the UCITS and to the KIID before making any final investment decisions. The KIID for this fund is available, alongside the prospectus via Vanguard’s website. This is designed for use by, and is directed only at persons resident in the UK.
The information contained herein is not to be regarded as an offer to buy or sell or the solicitation of any offer to buy or sell securities in any jurisdiction where such an offer or solicitation is against the law, or to anyone to whom it is unlawful to make such an offer or solicitation, or if the person making the offer or solicitation is not qualified to do so. The information does not constitute legal, tax, or investment advice. You must not, therefore, rely on it when making any investment decisions. Potential investors are urged to consult their professional advisers on the implications of making an investment in, holding or disposing of shares and /or units of, and the receipt of distribution from any investment.
Vanguard will manage your investments in the Managed ISA and Managed SIPP on your behalf. You will not be able to place trades on your own account.
The Authorised Corporate Director for Vanguard LifeStrategy Funds ICVC is Vanguard Investments UK, Limited. Vanguard Asset Management, Limited is a distributor of Vanguard LifeStrategy Funds ICVC.
Issued by Vanguard Asset Management Limited, which is authorised and regulated in the UK by the Financial Conduct Authority.
© 2025 Vanguard Asset Management Limited. All rights reserved.
4748548

