How to invest confidently in all market conditions
Learn how to invest confidently in any market – from new highs to downturns. Discover why staying calm, investing regularly and focusing on the long term can help you avoid costly mistakes.
Investing can trigger a range of emotions, especially when stock markets are experiencing significant movements. When markets reach new highs, you might worry about an impending drop or get caught up in the excitement that the rally will continue indefinitely. On the other hand, falling markets can lead to concerns about further losses. Like many investors, you might find yourself wanting to invest more during market highs and then sell when they drop.
While no one can predict what markets will do next, our experience suggests that investors are best served by tuning out the noise and sticking to a disciplined long-term approach. Here are some key principles to keep in mind:
1. Stay calm
Market turbulence can be unsettling, especially when headlines speculate about imminent falls. However, it’s important to recognise that market downturns are simply part and parcel of investing; they can feel uncomfortable in the moment, but when viewed in hindsight, they are often just short-lived fluctuations within a long-term investment journey.
Making impulsive decisions can often backfire. Selling in a panic during a downturn, or out of fear that one is coming, can lock in losses and may mean missing out on future gains. Conversely, rushing to buy when the market is surging may lead to buying at elevated prices, increasing the risk of short-term losses if the market pulls back.
Successful investing is about having a solid plan and sticking to it, no matter what the market does in the short term.
2. Don't try to time the market
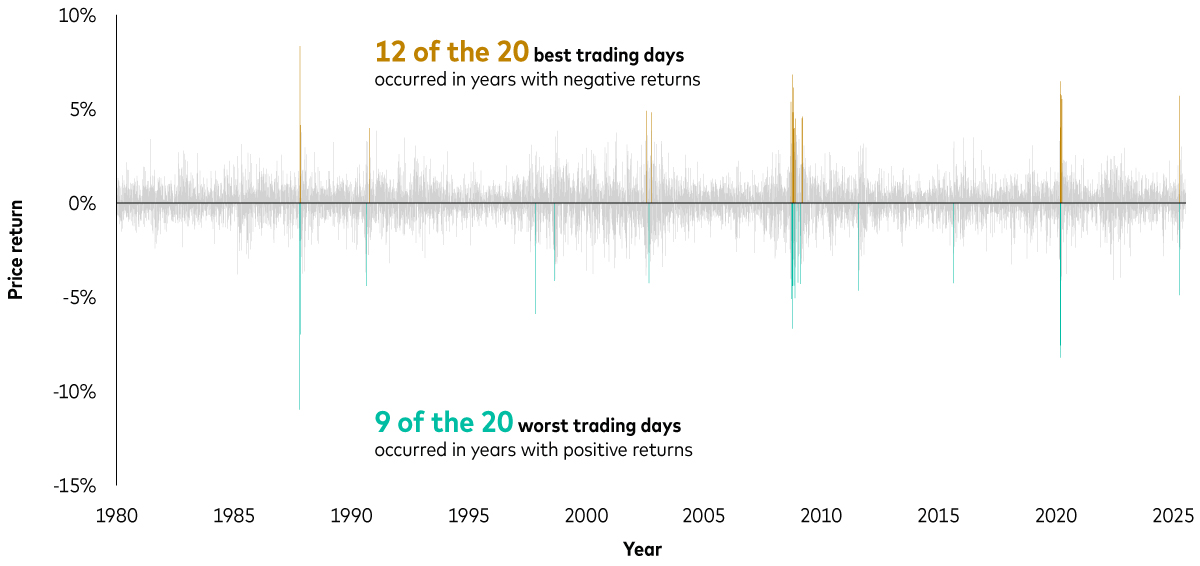
Trying to guess when to buy or sell is notoriously difficult, even for professional investors. One reason is that the best and worst trading days tend to occur close together. If you miss just a few of the best days, your long-term returns can suffer significantly.
The chart below illustrates this vividly. The 20 best trading days (the green bars) and the 20 worst trading days (the gold bars) often appear side by side, making successfully timing the market nearly impossible. This is why staying invested, rather than trying to jump in and out, is usually the smarter approach.
The best and worst trading days happen close together

Past performance is not a reliable indicator of future results.
Notes: The chart shows daily returns of the MSCI World Price Index from 1 January 1980 to 31 December 1987 and the MSCI AC World Price Index thereafter. The green bars highlight the 20 best trading days since 1 January 1980 and the gold bars highlight the 20 worst trading days since 1 January 1980.
Source: Vanguard calculations in GBP, based on data from Refinitiv, as at 15 July 2025.
3. Invest regularly
Investing every month, regardless of market conditions, helps to smooth out the impact of share price fluctuations. By investing a fixed amount at regular intervals, you buy more shares when prices are low and fewer when prices are high – a strategy known as pound-cost averaging. If markets do fall, you can rest assured you’ll be buying more at lower prices, increasing your chance of investment success.
4. Hold a diversified portfolio
Diversification is a cornerstone of sound investing. By spreading your investments across different assets, such as shares and bonds1, as well as different industries and regions of the world, it helps manage risk and smooth out returns over time. For example, if shares fall, high-quality bonds tend to rally, helping to cushion the blow. Similarly, if one particular industry experiences a downturn, other industries may perform differently, offering balance and resilience. Diversification isn’t about avoiding risk entirely, but about managing it wisely.
5. Focus on the long term – and remember that market dips are normal
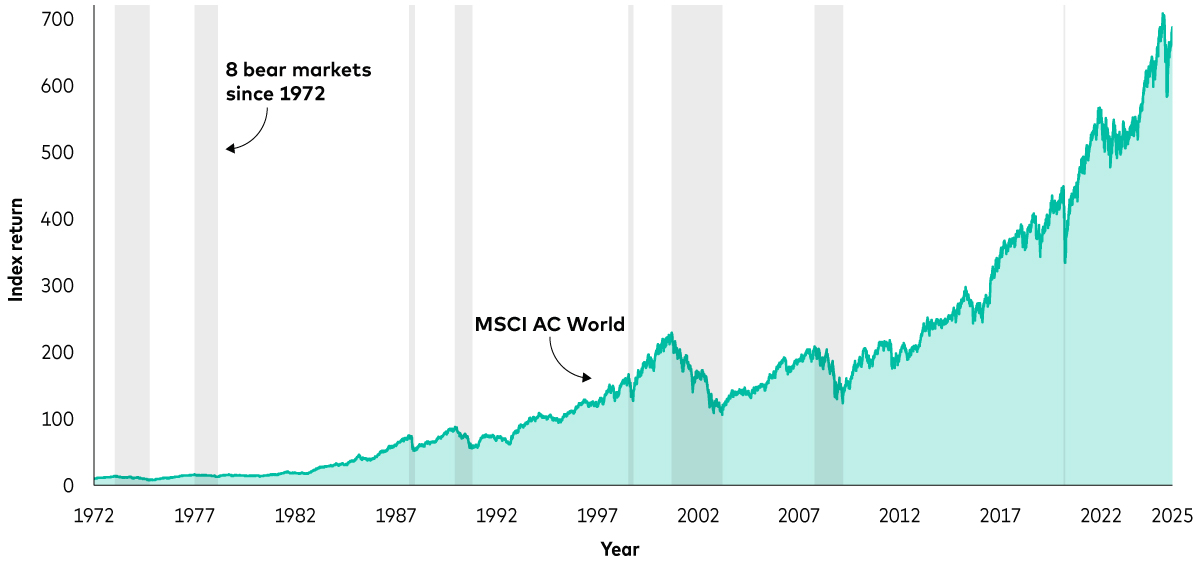
Successful investing is a marathon, not a sprint. Throughout history, markets have experienced multiple bear markets (defined as declines of more than 20% from the index’s recent high) yet have delivered strong long-term returns. For example, the chart below shows that since 1972, the MSCI World Index, which tracks the performance of global shares, has experienced eight bear markets (the grey shaded areas). After each bear market, the index bounced back and continued to grow.
By focusing on the long term, you’re more likely to see your money grow, even if there are some rough patches along the way. Remember, market dips are a normal part of investing and history shows that markets tend to recover and move higher over time.
The stock market’s resilience: growth through periods of decline

Past performance is not a reliable indicator of future results.
Notes: The chart shows the MSCI World Price Index from 1 January 1972 to 31 December 1987 and the MSCI AC World Price Index thereafter. The grey shaded areas represent bear markets, defined as price decreases of more than 20% from the most recent high.
Source: Vanguard calculations in GBP, based on data from Refinitiv, as at 15 July 2025.
6. Recognise that highs are often followed by more highs
Just as it’s normal to worry during market declines, it’s equally natural to feel uneasy when markets are rallying. You might worry that a high may be followed by a sharp decline, but history shows that markets often go on to reach more highs.
In December 1996, Alan Greenspan, then chair of the Federal Reserve (the US central bank), famously warned of “irrational exuberance” in the markets, suggesting that share prices might have risen too far, too fast. Despite this warning, stock markets continued to surge for another three years, only beginning to fall in February 2000. This goes to show that even those “in the know” don’t necessarily know what the markets will do next.
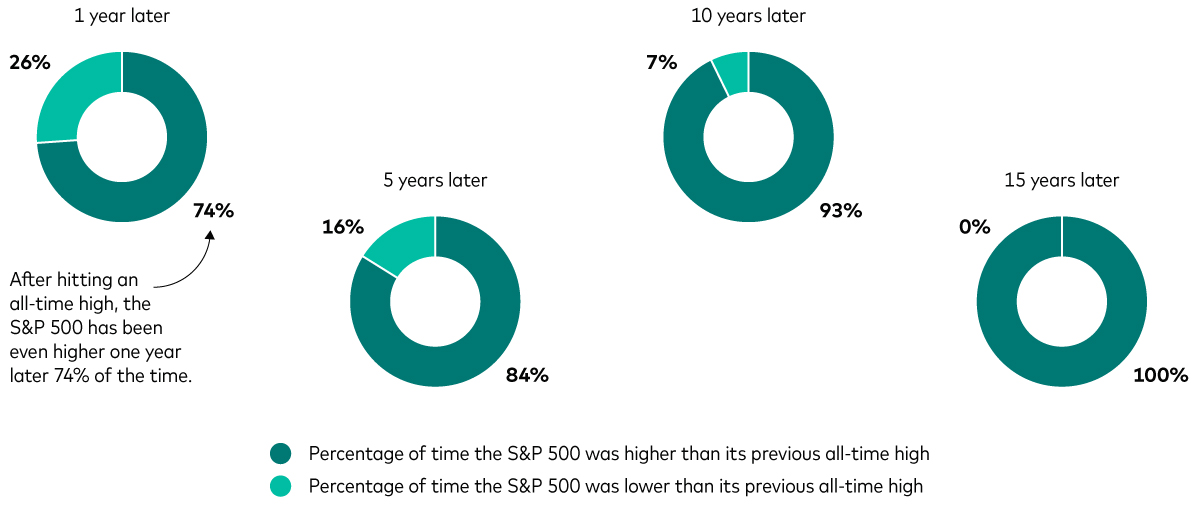
The pie charts below show how often the S&P 500, which tracks the 500 largest US companies, was above or below its previous all-time high over different time periods since 1950. For example, in the 5 years following an all-time high, the index was above its previous record 84% of the time.
How often has the stock market been higher or lower than the previous all-time high?

Past performance is not a reliable indicator of future results.
Notes: The pie charts show how often the S&P 500 was above or below its previous all-time high in the 1, 5, 10 and 15 years after reaching that high since 1950. The dark green segments show the proportion of time the index was higher than its previous record and the light green segments show the proportion of time it was lower. The calculations are based on the S&P 90 from 1950 to 1956 and the S&P 500 thereafter.
Source: Vanguard calculations based on data from FactSet, as at 31 August 2025.
Rather than trying to predict what will come next, it’s usually best to stick to your plan and invest consistently, building wealth over time through all types of market conditions.
1 Bonds are a type of loan issued by governments or companies, which typically pay a fixed amount of interest and return the capital at the end of the term.
Investment risk information
The value of investments, and the income from them, may fall or rise and investors may get back less than they invested.
Past performance is not a reliable indicator of future results.
Important information
Vanguard only gives information on products and services and does not give investment advice based on individual circumstances. If you have any questions related to your investment decision or the suitability or appropriateness for you of the product[s] described, please contact your financial adviser.
This article is designed for use by, and is directed only at persons resident in the UK.
The information contained herein is not to be regarded as an offer to buy or sell or the solicitation of any offer to buy or sell securities in any jurisdiction where such an offer or solicitation is against the law, or to anyone to whom it is unlawful to make such an offer or solicitation, or if the person making the offer or solicitation is not qualified to do so. The information does not constitute legal, tax, or investment advice. You must not, therefore, rely on it when making any investment decisions.
Issued by Vanguard Asset Management Limited, which is authorised and regulated in the UK by the Financial Conduct Authority. © 2025 Vanguard Asset Management Limited. All rights reserved.
4912990

