Why investors should expect only gradual rate cuts
The Bank of England has cut interest rates for the first time in four years. We discuss why rates will fall only gradually over the coming quarters.
The Bank of England has cut interest rates by 0.25 percentage points to 5%. Interest rates had previously been at a peak of 5.25% for over a year.
The move comes as the outlook for inflation, which measures the rise in the cost of goods and services, has improved. Core inflation, which excludes volatile food and energy prices, peaked at 7.1% in the 12 months to May 2023 and has since halved to 3.5%1. Both the Bank of England and our team of economists expect core inflation to hit the Bank’s 2% target by the second half of 2025.
Meanwhile, after a shallow recession2 in the second half of last year, the UK economy has rebounded. The economy grew by 0.7% in the first quarter compared with the previous quarter and we estimate it will have grown by another 0.7% in the second quarter. This is supported by household incomes now rising at a faster pace than the rate of inflation.
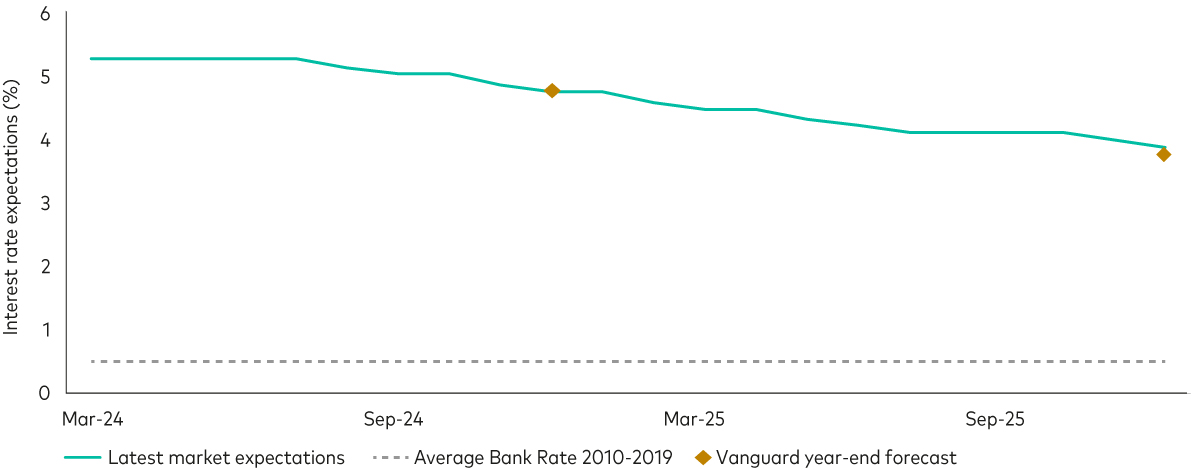
From here on, we anticipate that interest rates will fall only gradually. Interest rates are expected to be at 4.75% by the end of the year and around 3.75% by the end of 2025. This gradual approach is because both services inflation (the prices that consumers pay for services) and wage growth remain elevated and growth is picking up. The last mile in the fight against inflation will be difficult.
As the chart below shows, this view is broadly in line with what financial markets are expecting.
UK interest rates are expected to ease only gradually over the coming quarters

Note: The green line shows financial markets’ interest-rate expectations based on the overnight index swap curve until June 2025 (an overnight index swap is a type of financial contract designed to manage interest-rate risk). The gold diamonds are Vanguard’s forecasts. The grey dotted line shows the average level of Bank Rate (the Bank of England’s main interest rate) between the first quarter of 2010 and the fourth quarter of 2019. Data as at 25 July 2024.
Source: Bloomberg and Vanguard.
The key message is that, despite interest rates finally starting to fall, they will remain fairly high over the medium term. We do not believe we will go back to the experience of the previous decade, when rates averaged close to zero.
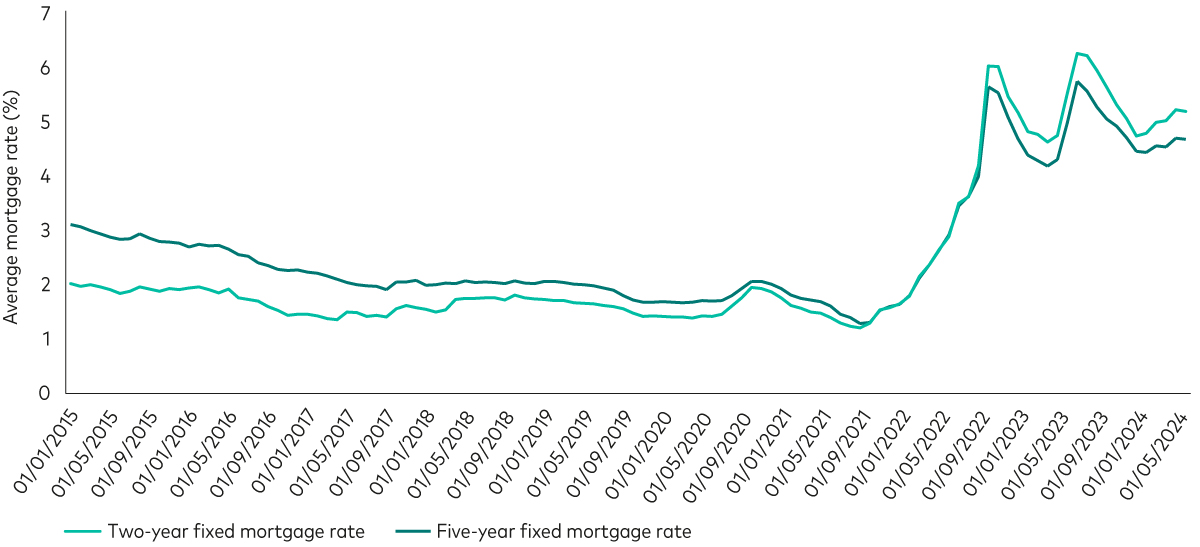
This is also reflected in the UK mortgage market, where lenders tend to anticipate interest rate changes in advance when setting mortgage rates. Most two- and five-year fixed mortgage rates remain above 4.5%3 (see chart below).
Average two- and five-year fixed mortgage rates

Source: Bank of England, as at 25 July 2024.
This higher interest-rate environment has important, and encouraging, implications for investors. It puts future returns from bonds4 and shares on a surer footing. We expect UK bonds and global ex-UK bonds to return an average of 4.2-5.2% and 4.4-5.4%, respectively, over the next 10 years for British pound investors5. This compares to a forecast of 0.8-1.8% for both UK and global ex-UK bonds back in the fourth quarter of 2021, which was before interest rates started rising.
Similarly, UK and global ex-UK shares are now expected to return 5.0-7.0% and 4.4-6.4%, respectively over the next decade. This compares to 4.2%-6.2% and 2.5-4.5% before interest rates started rising.
The shift to a higher interest-rate environment is something we’ve highlighted before in our annual outlook for 2024. To keep up to date with our latest macro and market views, read our monthly economic update.
1 As at June 2024, using data from the Office for National Statistics.
2 A recession is typically defined as two consecutive quarters of negative growth.
3 These rates assumes a loan-to-value ratio of 75%. In other words, someone who is borrowing 75% of the value of the home they want to buy.
4 Bonds are a type of loan issued by governments or companies, which typically pay a fixed amount of interest and return the capital at the end of the term.
5 As at 31 May 2024.
IMPORTANT: The projections or other information generated by the Vanguard Capital Markets Model® regarding the likelihood of various investment outcomes are hypothetical in nature, do not reflect actual investment results, and are not guarantees of future results. VCMM results will vary with each use and over time. The VCMM projections are based on a statistical analysis of historical data. Future returns may behave differently from the historical patterns captured in the VCMM. More important, the VCMM may be underestimating extreme negative scenarios unobserved in the historical period on which the model estimation is based.
The Vanguard Capital Markets Model® is a proprietary financial simulation tool developed and maintained by Vanguard’s primary investment research and advice teams. The model forecasts distributions of future returns for a wide array of broad asset classes. Those asset classes include US and international equity markets, several maturities of the U.S. Treasury and corporate fixed income markets, international fixed income markets, US money markets, commodities, and certain alternative investment strategies. The theoretical and empirical foundation for the Vanguard Capital Markets Model is that the returns of various asset classes reflect the compensation investors require for bearing different types of systematic risk (beta). At the core of the model are estimates of the dynamic statistical relationship between risk factors and asset returns, obtained from statistical analysis based on available monthly financial and economic data from as early as 1960. Using a system of estimated equations, the model then applies a Monte Carlo simulation method to project the estimated interrelationships among risk factors and asset classes as well as uncertainty and randomness over time. The model generates a large set of simulated outcomes for each asset class over several time horizons. Forecasts are obtained by computing measures of central tendency in these simulations. Results produced by the tool will vary with each use and over time.
The primary value of the VCMM is in its application to analysing potential client portfolios. VCMM asset-class forecasts—comprising distributions of expected returns, volatilities, and correlations—are key to the evaluation of potential downside risks, various risk–return trade-offs, and the diversification benefits of various asset classes. Although central tendencies are generated in any return distribution, Vanguard stresses that focusing on the full range of potential outcomes for the assets considered, such as the data presented in this paper, is the most effective way to use VCMM output.
The VCMM seeks to represent the uncertainty in the forecast by generating a wide range of potential outcomes. It is important to recognise that the VCMM does not impose “normality” on the return distributions, but rather is influenced by the so-called fat tails and skewness in the empirical distribution of modeled asset-class returns. Within the range of outcomes, individual experiences can be quite different, underscoring the varied nature of potential future paths. Indeed, this is a key reason why we approach asset-return outlooks in a distributional framework.
Investment risk information
The value of investments, and the income from them, may fall or rise and investors may get back less than they invested.
Any projections should be regarded as hypothetical in nature and do not reflect or guarantee future results.
Important information
Vanguard Asset Management Limited only gives information on products and services and does not give investment advice based on individual circumstances. If you have any questions related to your investment decision or the suitability or appropriateness for you of the product[s] described, please contact your financial adviser.
This article is designed for use by, and is directed only at persons resident in the UK.
The information contained herein is not to be regarded as an offer to buy or sell or the solicitation of any offer to buy or sell securities in any jurisdiction where such an offer or solicitation is against the law, or to anyone to whom it is unlawful to make such an offer or solicitation, or if the person making the offer or solicitation is not qualified to do so. The information does not constitute legal, tax, or investment advice. You must not, therefore, rely on it when making any investment decisions.
Issued by Vanguard Asset Management Limited, which is authorised and regulated in the UK by the Financial Conduct Authority.
© 2024 Vanguard Asset Management Limited. All rights reserved.

