How to navigate market turbulence
Market turbulence can be unsettling, but it’s important to remember it is a fact of life. These key points can help you navigate choppy markets.
We know it can be unsettling when stock markets are turbulent, especially if you’re new to investing.
But it’s important to remember that market ups and downs are a normal part of investing.
Here are three things to remember when markets are unsettled.
You are likely to experience many market dips in your investing lifetime. Over the long-term, though, markets have typically posted strong results.
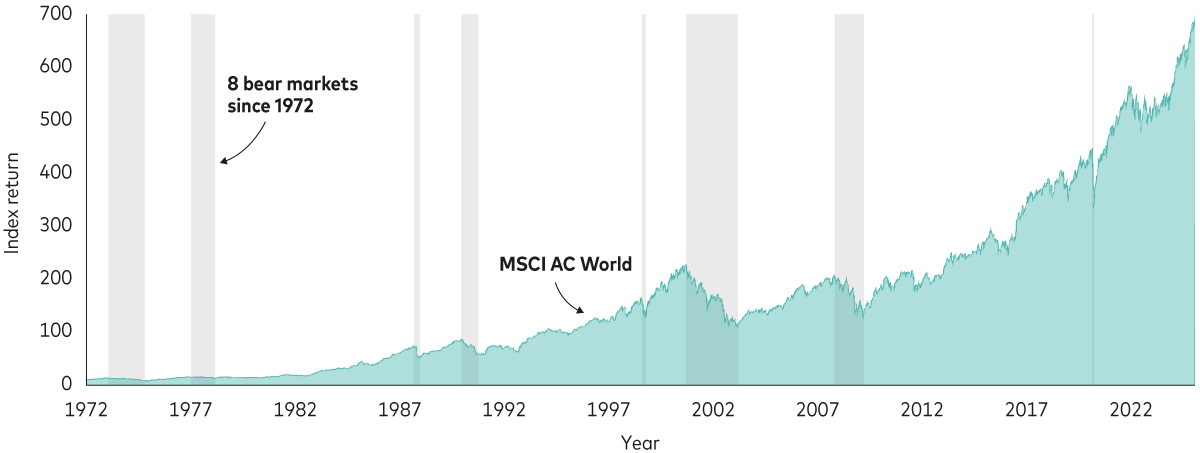
Over the past 50 years, there have been eight periods when shares fell more than 20%. But overall, shares went on to give strong returns, and a £100 investment in 1972 would have grown to more than £7,000 by 2025. Investors who stayed invested reaped the benefits.
It’s natural to want to sell when share prices fall to protect your investments and, at the time, you may feel better if you do.
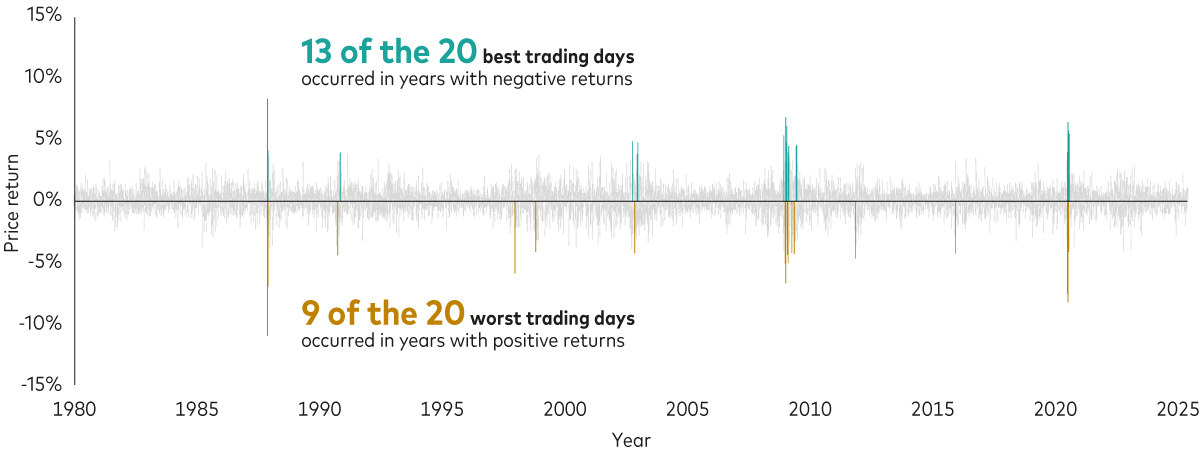
But it’s very difficult to predict the best times to buy or sell investments. Even professional investors don’t always get it right. That’s because the stock market’s best and worst days tend to happen close together, so if you sell your investments after a 10% drop, you might miss out on a 10% gain when the stock market bounces back.
We are programmed to take action. But if a market downturn occurs and your goals haven’t changed, staying the course and riding out the dips is usually the right course of action.
Although investments can go down as well as up in value, our research has found that the longer you are out of the market, the higher the chance of doing worse than an investor who stayed invested.
In summary, tuning out the noise and staying focused on your long-term goals can help you navigate the inevitable ups and downs of investing.
Stock markets have been turbulent recently, fuelled by concerns about the impact of trade tariffs1 and uncertainty in the economic and political environment. While this is understandably unnerving, it’s important to remember that market ups and downs are a normal part of investing.
While there may be further market turbulence in the weeks and months ahead, our research shows that staying invested tends to reward long-term investors.
You are likely to experience many market dips in your investing lifetime, but staying the course and riding out the dips is usually the right course of action.
Here are some tips for navigating choppy markets.
1. Bear markets are a part of life; keep a long-term focus
Since 1972, the MSCI World Index, which is an index comprising global shares, has experienced eight bear markets (the grey shaded areas in the chart below). A bear market is defined as a fall of more than 20% from the index’s most recent high. History has shown that shares typically post strong results over long periods, as the chart below shows.
Downturns aren’t rare events

Past performance is not a reliable indicator of future results.
Notes: The chart shows the MSCI World Price Index from 1 January 1972 to 31 December 1987 and the MSCI AC World Price Index thereafter. The grey shaded areas represent bear markets, defined as price decreases of more than 20% from the most recent high.
Source: Vanguard calculations in GBP, based on data from Refinitiv, as at 17 January 2025.
When markets fall, it’s important to consider staying invested so that you can participate in the recoveries that typically follow.
2. Timing the market is futile
One reason investors shouldn’t try to time the market is that they run the risk of missing out on strong performance, which can seriously hamper long-term investment success.
Historically, the best and worst trading days have tended to occur close together, often during periods of heightened market uncertainty. In the chart below, the gold bars, which represent the 20 worst trading days, look like mirror images of the green bars, which signify the best trading days. This makes the prospect of successfully timing the market almost impossible.
The best and worst trading days happen close together

Past performance is not a reliable indicator of future results.
Notes: The chart shows daily returns of the MSCI World Price Index from 1 January 1980 to 31 December 1987 and the MSCI AC World Price Index thereafter. The green bars highlight the 20 best trading days since 1 January 1980 and the gold bars highlight the 20 worst trading days since 1 January 1980.
Source: Vanguard calculations in GBP, based on data from Refinitiv, as at 17 January 2025.
3. Don’t panic during market turmoil
Investors who sell their investments and switch to cash during stock market downturns have typically underperformed those who remain invested.
As the chart below shows, the longer you are out of the market, the worse that underperformance tends to be. For example, an investor who switches to cash for three months has a 61% chance of underperforming someone who remains invested in a balanced portfolio. The average underperformance is -1.6%. If they switch to cash for 12 months, those numbers are 79% and -9.1%, respectively.
The chance of underperforming if you switch investments to cash

Past performance is not a reliable indicator of future results.
Notes: The chart shows the returns of cash versus a global 60% share/40% bond portfolio in 3-, 6- and 12-month periods after 3-month total returns of global shares were below 5%. Shares are represented by the MSCI AC World Total Return Index. Bonds are represented by the Bloomberg Global Aggregate Bond Index Sterling Hedged. Cash is represented by Sterling 3-Months Deposits, which mirrors what an individual could get in a 3-month fixed-rate savings account. Data is based on the period between 31 January 1990 and 31 December 2024.
Source: Vanguard calculations in GBP, based on data from Refinitiv, as at 31 December 2024.
What you can do when markets are turbulent
Here are some simple steps to help you avoid overreacting to short-term downturns and position yourself for long-term success:
Tune out the noise
There’s an old adage that you should never check your portfolio when stock markets are falling. It’s a wise recommendation. As the charts above show, making a hasty decision could mean your investments underperform and you don’t meet your investment goals.
Set realistic expectations
Historical return averages are simply that – averages. The average will be made up of good and bad years – that’s what investing is.
Stay diversified
One way to insulate your portfolio is to blend shares and bonds2 in a way that suits your attitude to risk and goals. Bonds have historically helped to stabilise portfolios during stock market downturns. By having a broad spread of investments across global markets, you can benefit from investments that may perform well when others are falling.
1 Trade tariffs are taxes on imported goods.
2 Bonds are a type of loan issued by governments or companies, which typically pay a fixed amount of interest and return the capital at the end of the term.
Investment risk information
The value of investments, and the income from them, may fall or rise and investors may get back less than they invested.
Past performance is not a reliable indicator of future results.
Important information
Vanguard only gives information on products and services and does not give investment advice based on individual circumstances. If you have any questions related to your investment decision or the suitability or appropriateness for you of the product[s] described, please contact your financial adviser.
This article is designed for use by, and is directed only at persons resident in the UK.
The information contained herein is not to be regarded as an offer to buy or sell or the solicitation of any offer to buy or sell securities in any jurisdiction where such an offer or solicitation is against the law, or to anyone to whom it is unlawful to make such an offer or solicitation, or if the person making the offer or solicitation is not qualified to do so. The information does not constitute legal, tax, or investment advice. You must not, therefore, rely on it when making any investment decisions.
Issued by Vanguard Asset Management Limited, which is authorised and regulated in the UK by the Financial Conduct Authority.
© 2025 Vanguard Asset Management Limited. All rights reserved.
4321583


